July 21, 2018 at 03:25PM Viz of the Day Visual Vocabulary
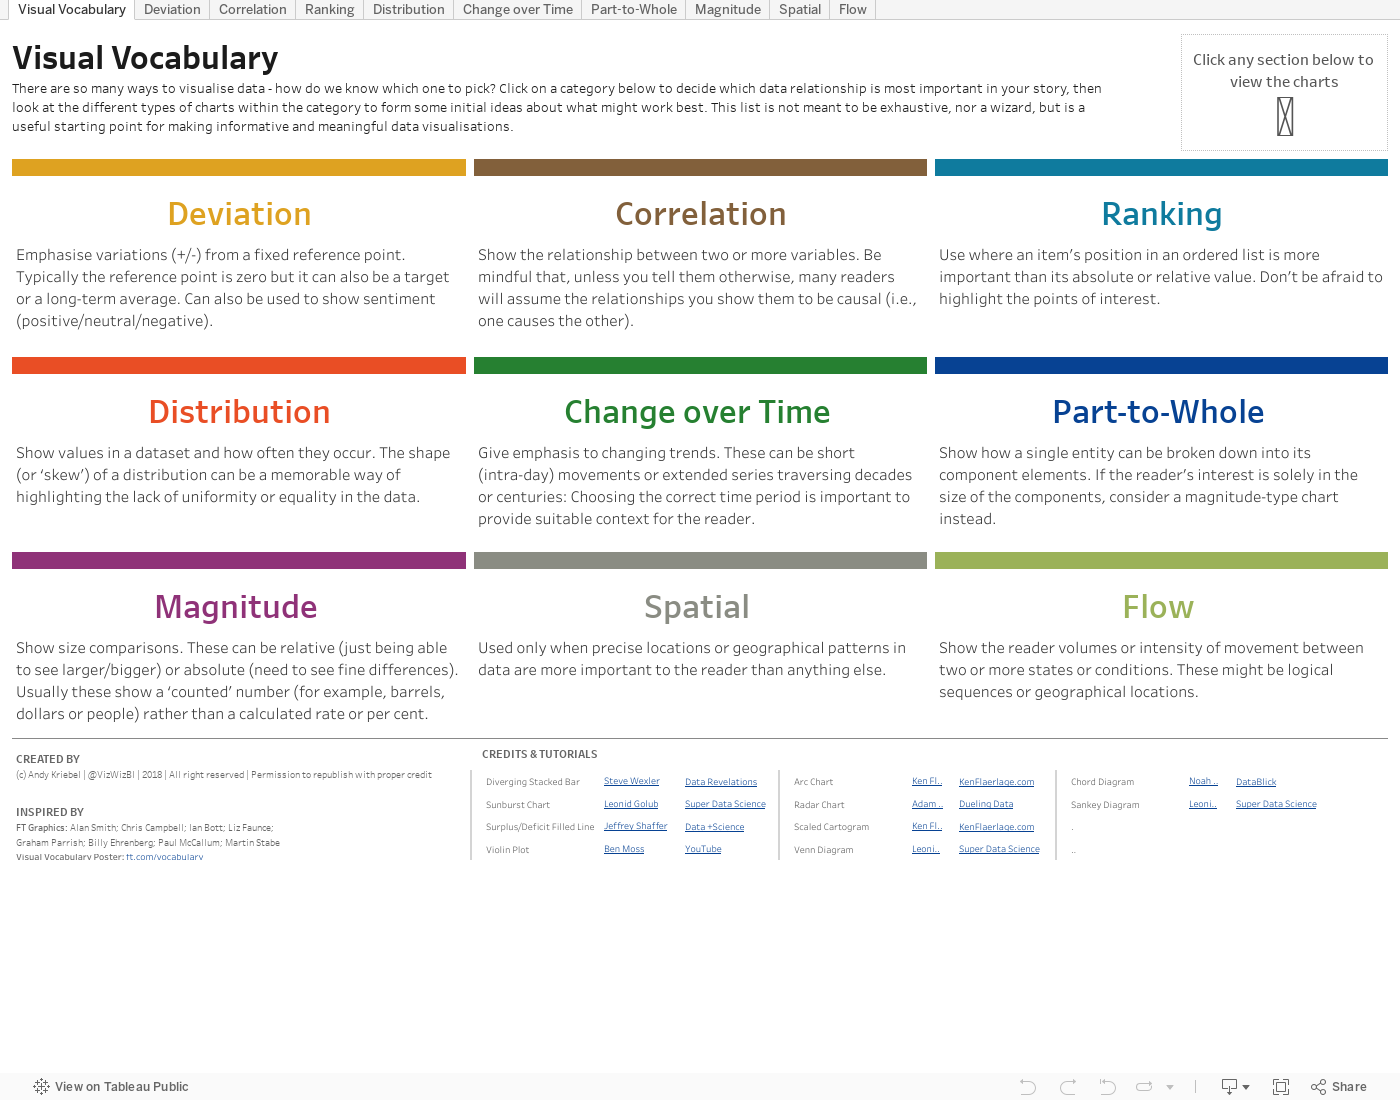 In this visual vocabulary, Andy Kriebel recreates the Financial Times Visual Vocabulary in Tableau. An interactive workbook to assist data analysts to select the optimal symbology for data visualisation.
Join us as we explore the engaging work of Tableau Public authors around the world:
- Sign up for the Viz of the Day email
- Follow us on Twitter
- Bookmark the Viz of the Day page
If you’d like to nominate a visualization, please do: email public@tableau.com.